The Structure Beneath the Story
The argument for narrative impact assessment has been won. Funding bodies, institutions, and reform movements across the world have largely concluded that citations alone cannot tell you whether research mattered. Journal metrics cannot capture a clinical guideline rewritten, a community health programme redesigned, or a government policy informed by a decade of fieldwork. The narrative case study exists because numbers were not enough.
Yet the question that follows, rarely asked, is what happens to those narratives once they are written. Where do they go? Who reads them again? And when the same evidence is needed six months later in a different format, who extracts it?
The paradox we identified previously has not gone away. It has simply moved. The old version was that evaluation consumed the time meant for research. The new version is subtler: narrative assessment is richer and more honest than metrics, but the evidence inside it is locked in prose, inaccessible to any system that needs to find, compare, or reuse it. The cure works. But it creates a problem of its own.
Other fields have been here before. Epidemiology did not abandon the patient case report when it built disease registries. It added structure alongside the story, so that patterns across thousands of cases could be read without erasing any single one. Research impact evidence needs the same thing.
This post is about that resolution. Not a return to metrics, but a structural layer beneath the narrative that keeps evidence findable and reusable without flattening the story above it.
The Evidence You Already Have
Consider a researcher who finishes a three-year project that changed clinical practice in regional hospitals. She writes the impact case study. It is good: specific, well-evidenced, grounded in named stakeholders and quantified outcomes. The narrative does what narratives do. It makes the research matter to someone who was not in the room.
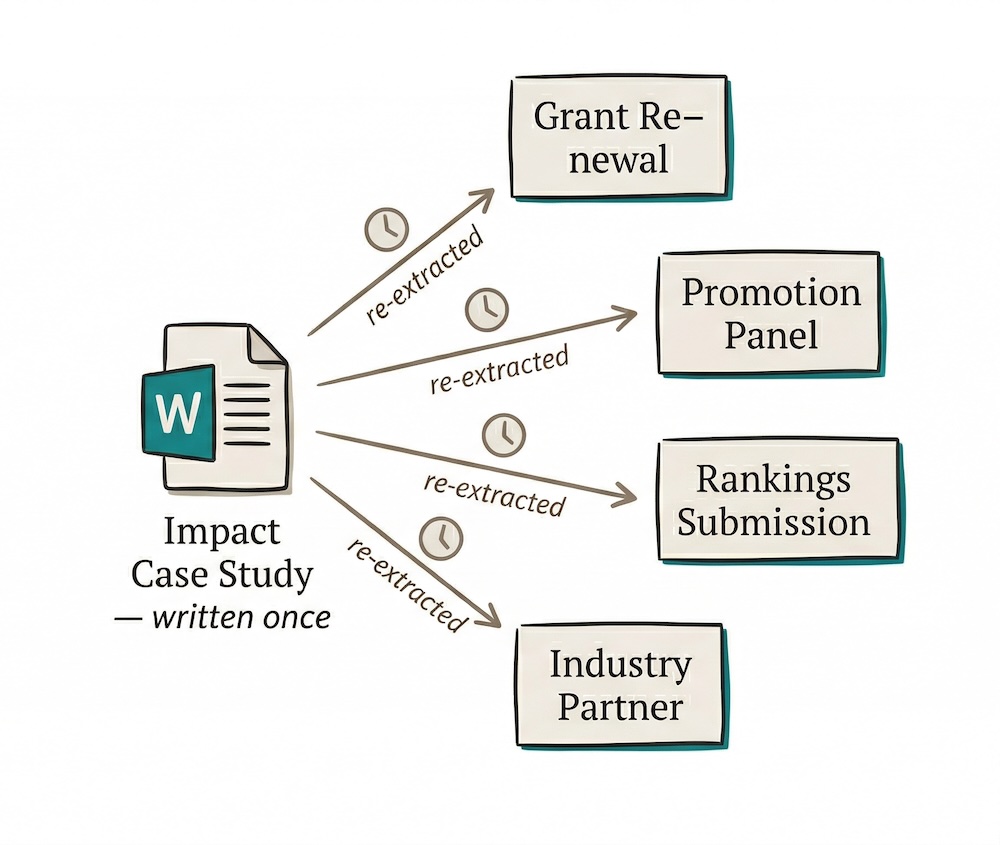
Then the grant renewal arrives. She opens the document, finds the right paragraph, extracts a number, and reformats it for the application template.
Three months later, the promotion panel asks for evidence of societal contribution. She opens the same document. Finds the same paragraph. Copies a different sentence into a different form.
Then the university rankings submission needs SDG alignment. Then a potential industry partner asks for a summary of translational outcomes. Each time, it is the same forty-five minutes. Each time, she is locating evidence she already has, in a document she already wrote, for an audience that will never see the document itself.
It is not a crisis. It is a quiet, grinding inefficiency, the kind that never appears in a budget report because it is spread too thinly to notice and too routine to question. But the hours are not the worst of it. Research that changed clinical practice for thousands of patients can fail a grant assessment simply because the assessor could not find the evidence in time, or because the researcher ran out of patience to reconstruct it for the fourth time that year.
The evidence was created once. The extraction work is repeated indefinitely.
We described a version of this waste in the research assessment paradox, where 550 working years were spent on grant proposals in a single Australian funding cycle. Nobody is counting the hours lost to re-extracting impact evidence from narratives. But across a faculty, across a university, across a career, the cost adds up.
A Narrative Cannot Be Filtered
Most research offices frame this as a resource problem. If only there were more staff, more time, better templates. But it is not a resource problem. It is an architectural one.
Consider what your bank does that your diary cannot. Both record every transaction. But one lets you search by date, filter by category, and calculate a total in seconds. The diary is not wrong. It is just not built to be queried. Narrative impact case studies have the same limitation. They are designed to communicate to a human reader, not to be searched by a database. A sentence cannot be filtered. A paragraph cannot be sorted. A folder of Word documents cannot answer "which of our researchers have achieved policy adoption in the last three years?" without someone reading every page.
The evidence in paragraph four of your impact case study is invisible to every spreadsheet in your research office.
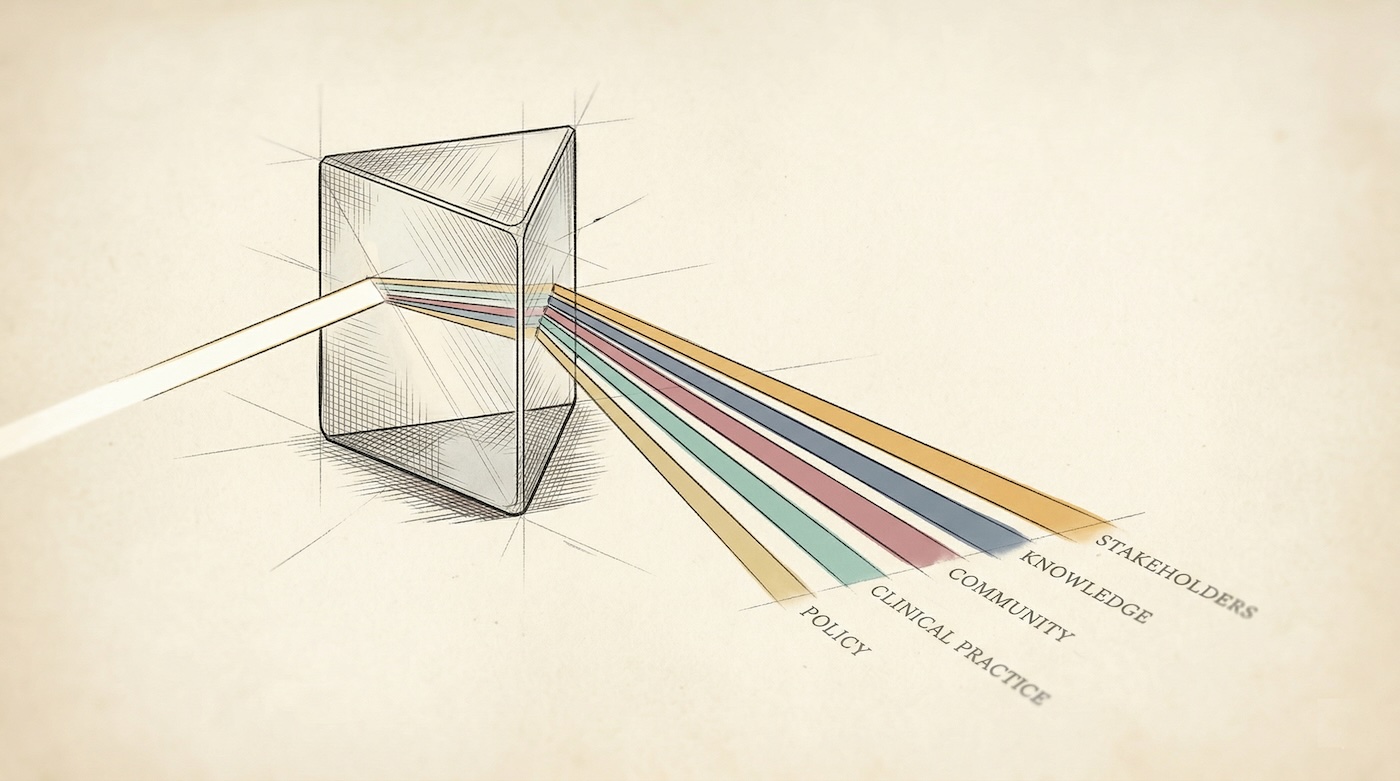
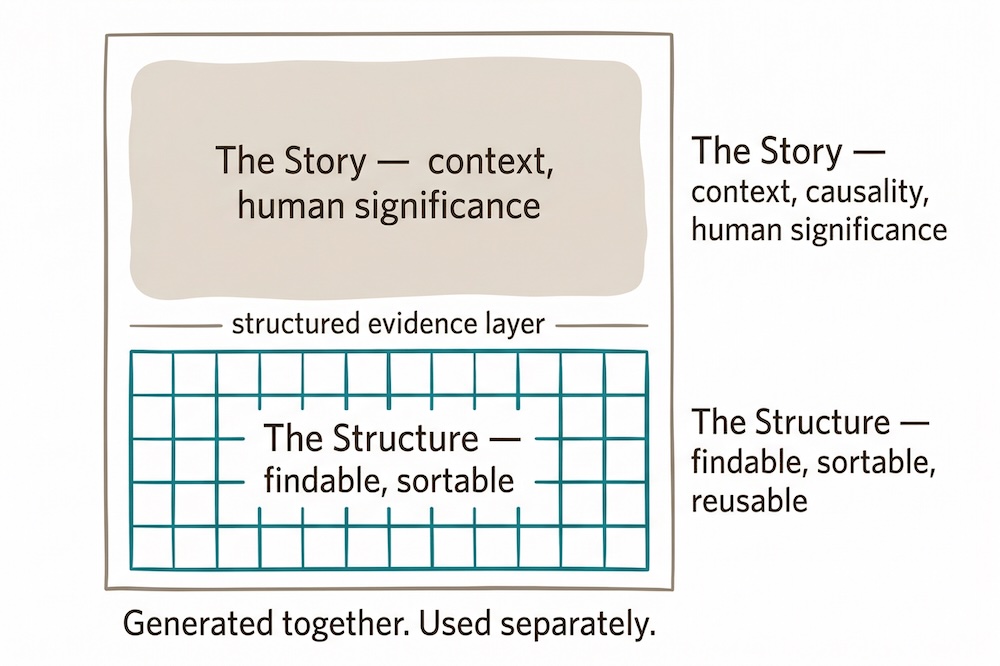
These are two different jobs. The narrative tells the story of how research created change. Structured data makes the specific claims, named stakeholders, quantified outcomes, and source references findable, sortable, and reusable. One document cannot do both well, not because the writing is poor, but because prose and data are built for different things.
A narrative without structured evidence is a claim. Structured evidence without a narrative is a spreadsheet. You need both.
What Structure Makes Possible
When impact evidence is structured alongside the narrative, things that were previously laborious become straightforward.
Grant applications. Retrospective impact evidence from previous grants is the strongest signal of future translational potential. Every major funder asks for it. With structured evidence, populating a grant application's impact section takes minutes rather than days, because the evidence already exists as queryable rows: what happened, who was affected, what changed, and where the source is. A flag on each evidence item also distinguishes what has already occurred from what is projected. Funders want to know whether you are reporting evidence or making promises, and conflating the two is one of the most common weaknesses in impact statements.
Promotion and performance review. Promotion panels increasingly ask for evidence of impact beyond publications. A structured evidence record gives researchers a curated, sortable record across their career. When a panel has forty submissions and limited time, being able to surface the three strongest items without reading twenty pages is not a shortcut. It is how panels actually work.
Technology transfer. A Technology Readiness Level trajectory, captured as a start point and an end point with a source reference, quantifies the translational journey in a single data point. A TRL 2 to TRL 7 progression tells a commercialisation story that three paragraphs of narrative might obscure. Technology transfer offices speak this language already. The problem is that TRL data is almost never captured in a structured form alongside impact case studies.
Partner and funder conversations. Showing a stakeholder table with engagement levels and geographic scope is more direct and more persuasive in a partnership meeting than asking someone to read a case study and infer who was involved and how. The same data that serves a submission also serves a conversation.
Impact is not a number. It is a change from a baseline. Most impact reports contain the number but not the baseline. "25,000 patients reached" is a statement. "25,000 patients reached against a baseline of 3,000, representing a 733% increase over four years" is evidence. Structured data captures both values with dates. The trajectory becomes the point, not just the endpoint.
Evidence Quality Is Not Evidence Accessibility
Two things get conflated here that should not be. The quality of your evidence and the accessibility of your evidence are separate problems.
The evidence may be excellent. Rigorous, sourced, significant. A policy change traced to a specific research output. A clinical protocol adopted across three states. A training programme reaching thousands of practitioners. All of this may be documented with care and precision inside a narrative case study, and still be, in practice, invisible, because it lives only in prose, inaccessible to any system that needs to aggregate, compare, or verify it. The research office cannot filter it. The institutional dashboard cannot display it. The next grant application cannot pull from it without someone reading the document and copying the relevant details into a new format.
The problem is not that qualitative impact cannot be quantified. It is that it has never been structured. Stakeholder engagement, policy adoption, community partnerships: these are qualitative by nature. But they can still be captured as structured rows with type, engagement level, and significance. That does not reduce them to numbers. It makes them visible to systems that otherwise cannot see them at all.
This is also where consistency matters. If one researcher describes their impact as "policy influence" and another calls identical work "government engagement", those terms are invisible to each other in any aggregated view. A controlled vocabulary, applied consistently across all reports, is the only thing that makes comparison possible across researchers, faculties, and years. It is unglamorous work, but without it, institutional reporting is just a collection of cases that cannot speak to each other.
What the Structured Workbook Contains
ResearchImpact AI generates a seven-sheet Excel workbook alongside every narrative report. Each sheet serves a distinct purpose; together they form the structured evidence record that the narrative alone cannot provide. The AI handles the mechanical transcription. The researcher handles the judgement. Every evidence row is flagged as AI-extracted by default.
| Sheet | Purpose | Key fields |
|---|---|---|
| Case Study | Core metadata per researcher | Institution, research problem, impact type, funding sources, date ranges, ORCID |
| Impact Evidence | One row per evidence claim | Type, description, source URL, significance (1–5), geographic reach, retrospective / projected flag |
| Metrics | Quantitative outcomes in context | Baseline value, current value, % change, measurement date |
| Research Outputs | Outputs classified by framework | Category (novel knowledge, capacity building, health system improvement), mapped to funder reporting structures |
| Stakeholders | Named engagement record | Type, engagement level (co-creation / active partner / funder / informed), sector, geographic scope |
| Publications | Structured publication list | Citation counts, open access status, DOIs drawn from Semantic Scholar |
| Taxonomy | Controlled vocabularies | 14 UN SDGs, TRL scale 1–9, standardised impact types and engagement levels |
The taxonomy sheet is what makes reports from different researchers, faculties, and years comparable at all. The workbook follows the FAIR data principles: findable, accessible, interoperable, reusable. Impact evidence, for the first time, meets the same standard we already expect of research data itself.
What Becomes Possible
Making individual evidence findable is only part of the story. When you stack case studies, something else becomes possible.
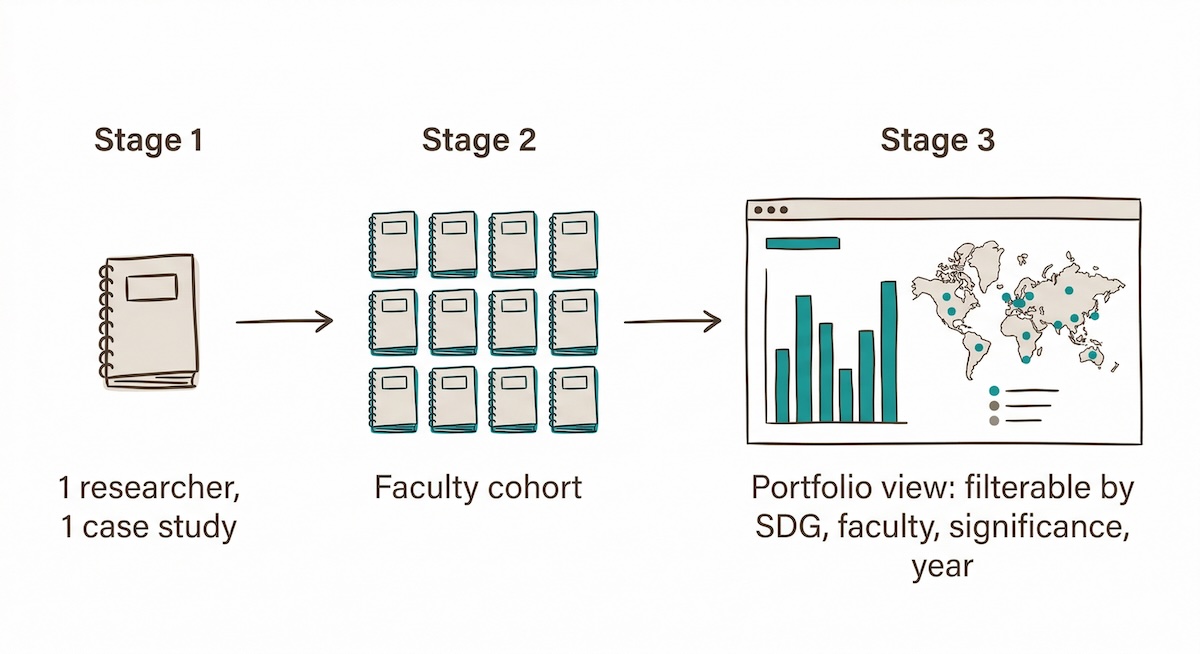
Stack fifty case studies and you have a portfolio. The structured workbook feeds into any visualisation tool: Power BI, Tableau, Looker Studio, or a well-built spreadsheet. A research office with a hundred case studies can build a live portfolio map showing impact types by faculty, significance distribution across disciplines, SDG coverage, geographic reach, and stakeholder sectors. Questions that previously required reading hundreds of documents can be answered in a minute.
You cannot graph a paragraph. But you can graph a structured evidence record. When you do, university leadership can see the shape of its impact portfolio without waiting for a triennial report assembled under deadline pressure.
Track impact over time. An institutional impact register, built by stacking one workbook per researcher, grows more useful with each reporting cycle. The same evidence item rated significance 2 in 2022 and significance 4 in 2025 tells a maturation story that no folder of documents could. Over time, you can see which impacts are growing, which have plateaued, and which projects are gaining traction in policy or industry adoption.
Build a personal evidence library. For individual researchers, the benefit runs the other way. A structured evidence record becomes the document you draw from for every future grant application, promotion case, or industry pitch. Impact statements stop being rewritten from scratch. They are assembled from verified, rated evidence rows that were captured once and never need to be re-extracted.
When an institution has hundreds of these records, the questions it can ask about its own research portfolio change entirely. That is a larger argument, one about institutional infrastructure rather than individual evidence, and it deserves its own treatment. But it starts here, with the decision to produce structured data alongside every narrative.
The Resolution
The shift away from citation counts as the primary measure of research value is real and it is good. What has replaced them is richer and more honest: narrative evidence of real-world change, stakeholder engagement, policy influence, clinical adoption, community benefit.
But narrative evidence only holds up under scrutiny if the claims within it are accessible, verifiable, and reusable. The paradox was that choosing narrative over metrics meant gaining richness but losing manageability. Structured data beneath the narrative resolves it. You keep the story. You add the infrastructure that makes the story's evidence findable.
When epidemiology moved from individual case reports to structured registries, it did not diminish the individual patient story. It made the pattern across thousands of them visible for the first time. When genomics built sequence databases, individual discoveries became part of a commons that accelerated every subsequent discovery. The stories were not replaced. They were made into something an institution could learn from.
Research impact evidence is ready for the same move. The stories are already being written. What has been missing is the structure beneath them.
ResearchImpact AI now generates both from a single analysis run: the narrative case study and the structured evidence workbook. Not because the spreadsheet replaces the story, but because the story, on its own, is only half the job.
The next time someone asks for your impact evidence in a format you did not anticipate, the answer should already exist. It should not require you to open a Word document and start reading.
ResearchImpact AI generates narrative case studies and structured evidence workbooks from a single analysis. Explore the platform to see what your research impact looks like as both a story and a dataset.
See it in action: watch a short demo of the platform generating both layers from a single research profile.